
The equity markets have been anything but kind to investors long stocks. Nearly all the broad market equity indices are in negative territory for the year. The S&P 500 Index: -6.2%, Dow Jones Industrial Average: -8.5%, S&P MidCap Index: -4.4% and the S&P SmallCap Index: -4.6%. Simply reviewing social media comments from investors, one could be lead to believe the market has no where to go but down. Admittedly, the market trend and direction of least resistance does seem to favor the bears; however, some technical data is beginning to potentially signal a turn to a more bullish posture.
In August when the S&P 500 Index dropped to 1,867 the CBOE Equity Put/Call Ratio spiked to over 1.0 indicating a potentially oversold market. The market did recover from that August low, but recently has resumed its downtrend. Sometimes a better indicator is to look at the 21-day moving average of the put/call ratio. As can be seen in the below chart, the moving average of this ratio has begun to trend lower after reaching a high of .79 on 9/18/2015. Declines in this ratio are generally associated with a market that trends higher on a go forward basis.
 |
| From The Blog of HORAN Capital Advisors |
From an individual investor sentiment perspective, the recent American Association of Individual Investors' weekly Sentiment Survey indicated the individual investor bullish sentiment remains at low levels. This is a contrarian measure and low bullish sentiment is associated with a market that tends to be oversold.
 |
| From The Blog of HORAN Capital Advisors |
In looking at the market (S&P 500 Index) itself, various technical indicators are attempting to form bullish patterns. The below chart represents the daily view of the S&P 500 Index and the last technical indicator on the chart, the Money Flow Index, is tracing out a series of higher lows. Not so positive is the fact the MFI is also creating a series of lower highs and this is not a much different pattern the S&P 500 Index had created a few weeks ago. A move above the red resistance line for the MFI would be one positive technical indication for the market.
The MFI is a momentum indicator that is similar to the Relative Strength Index; however, the MFI is volume weighted. The volume weighting aspect provides one a view of the strength of money flowing in and out of a security or the market. It compares positive money flow to negative money flow in order to identify the strength or weakness of the price trend of a stock or index. Positive and negative divergences between the stock and the MFI can be used as buy and sell signals respectively, for they often indicate a potential reversal in the price trend. If the stock or index price is falling, but positive money flow is greater than negative money flow, then there is more volume associated with price increases than with the price declines. In the case of the S&P 500 Index below, the MFI suggests the index downtrend is weakening as money flowing into the index is stronger than money flowing out of it.
 |
| From The Blog of HORAN Capital Advisors |
Lastly, below is a weekly view of the S&P 500 Index and this view of the S&P has it tracing out another one of those pennant chart patterns. The Full Stochastic Indicator turned positive from an oversold level in late August at the same time the MFI touched an oversold level of 20.
 |
| From The Blog of HORAN Capital Advisors |
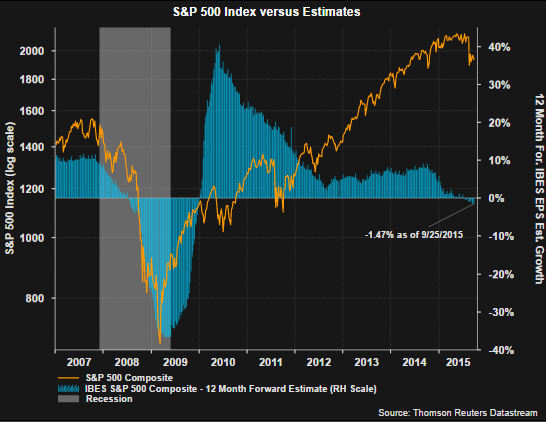
There are several factors contributing to the market uncertainty. What seems to be top of mind for investors is the Fed's decision surrounding when interest rates will be increased off the current zero rate level. At the end of the day a 25 or 50 basis point rate increase should have little impact to the market; however, investors have a heightened focus around this decision. More important will be the pace at which the Fed ultimately decides to move rates higher. Secondly, as we have noted in several earlier posts, a rate increase will likely result in the US Dollar continuing to strengthen with implications for international markets as well as multinational companies. The headwind for multinational firms will be tied to the negative currency impact. Already, earnings expectations for the market are anything but positive.
 |
| From The Blog of HORAN Capital Advisors |
As the above chart shows, forward earnings growth expectations have turned negative. Is this simply an energy/materials issue? Energy earnings have contracted 50%. If this issue is centered in energy and materials, is it due to oversupply or weaker demand, both in the U.S. and internationally? For additional insight into the earnings picture, Brian Gilmartin has a current earnings update at his firm's site.
In conclusion, it is easy to focus on the negatives as the direction of least resistance for the market at this time seems to be down. However, watching price and technicals will provide one with insight into the turning point of the market and maybe the market is nearing that turn.


No comments :
Post a Comment